The Visual Workplace
Burns Bridge understands the importance and idiosyncrasies of creating a visual workplace from creating a clean organized shop floor with clear lines of sight to the visual organization of business forms and backlog data to facilitate the management of the business. Burns Bridge can help you with your visual workplace needs.
Overview: "The visual workplace is a self-ordering, self-explaining, self-regulating, and self-improving work environment—where what is supposed to happen does happen, on time, every time, day or night—because of visual devices." , Gwendolyn Galsworth.
The visual workplace is an out shoot of Japan's just in time manufacturing system (aka Japanese Manufacturing Techniques or the Toyoda Production System) and is now called lean manufacturing. Some elements of this approach are  5S (see other page), Andon signalling systems, Kanban systems, colour coding of routing cards for dates, picture dominated shop floor work instructions, tool shadow boards, easy to read shelf labels and coloured floor markings to represent different types of work in process, and visual shop scheduling boards.
In a visual factory supervisors, staff and employees can see at a glance what is going on and where the problems are. e.g. Painted squares on the floor signal material handlers when to move material to the next process or in the alternative when to bring more material to keep a work station busy.
Offices and meeting rooms have windows which permit staff to see the shop floor and conversely, shop employees to see staff. Visual shops have clear lines of sight with little or no opportunities for employees to "hide". In such plants peer pressure automatically is brought to bear on the malingers without any need for supervisory cajoling. Supervisors no longer need to supervise but can spend the bulk of their time, planning and organizing, and leading and coordinating.
With robust error proofing in place such plants routinely operate at zero parts per million defective.
Visual Organization of Data:
1. Repair shop forms: A 3rd party rotating equipment facility repairs a wide variety of equipment from multiple OEM's. Inspection forms are machine specific and vary from device to device. Unless these documents are organized into groups that can be easily accessed, a great deal of indirect waste will be incurred. Errors in the repair process will be rife. The graphic below demonstrates a document dashboard appropriate for use in a 3rd party repair facility. This is a "visual" method or organizing access to documents.
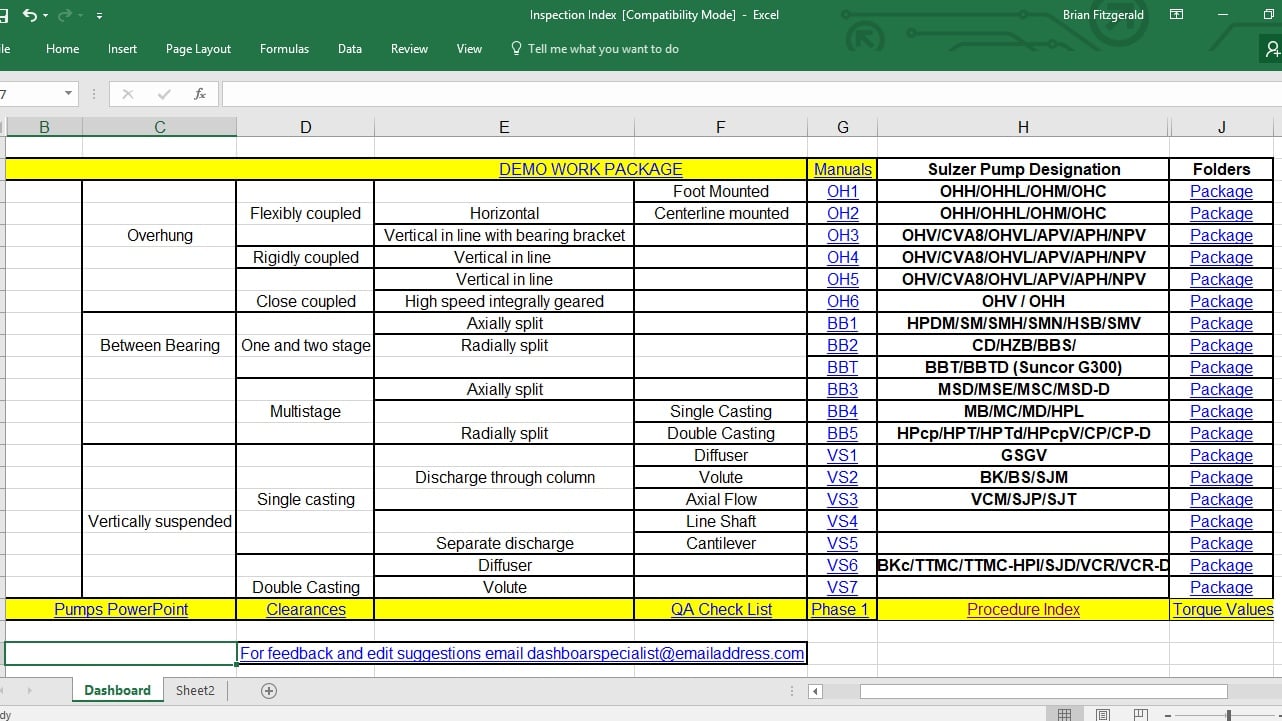
The above spreadsheet allows any user to instantly access a machine specific project repair package which includes a generic set of directories in addition to a complete set of inspection documents by clicking on the appropriate right hand hyperlinked cell. Coupled with shop floor laptops, paper can be eliminated, as shop floor employees access repair documents by job and can complete the job specific inspection form on a laptop as they perform an inspection. Multiple families of errors are eliminated using such a simple system. Leadtimes are reduced. Paper and paper files are eliminated. Each job becomes a pseudo wiki file which allows all users to add information, update files and forms etc. from inspection through to estimate and quote preparation.
2. Example: Visual Presentation of Repair Lead time Data An OEM pump repair shop had made considerable progress in reducing their repair lead time from almost two months to under twenty days. However the quote leadtime performance was not consistent with leadtimes rising to 30 days and then dropping back to twenty the next month. All staff members had a numerous theories as to a root cause. However it was felt prudent to collect some hard data first rather than jump to a conclusion and be wrong. The spreadsheet below summarizes data subsequently collected for a two month period.
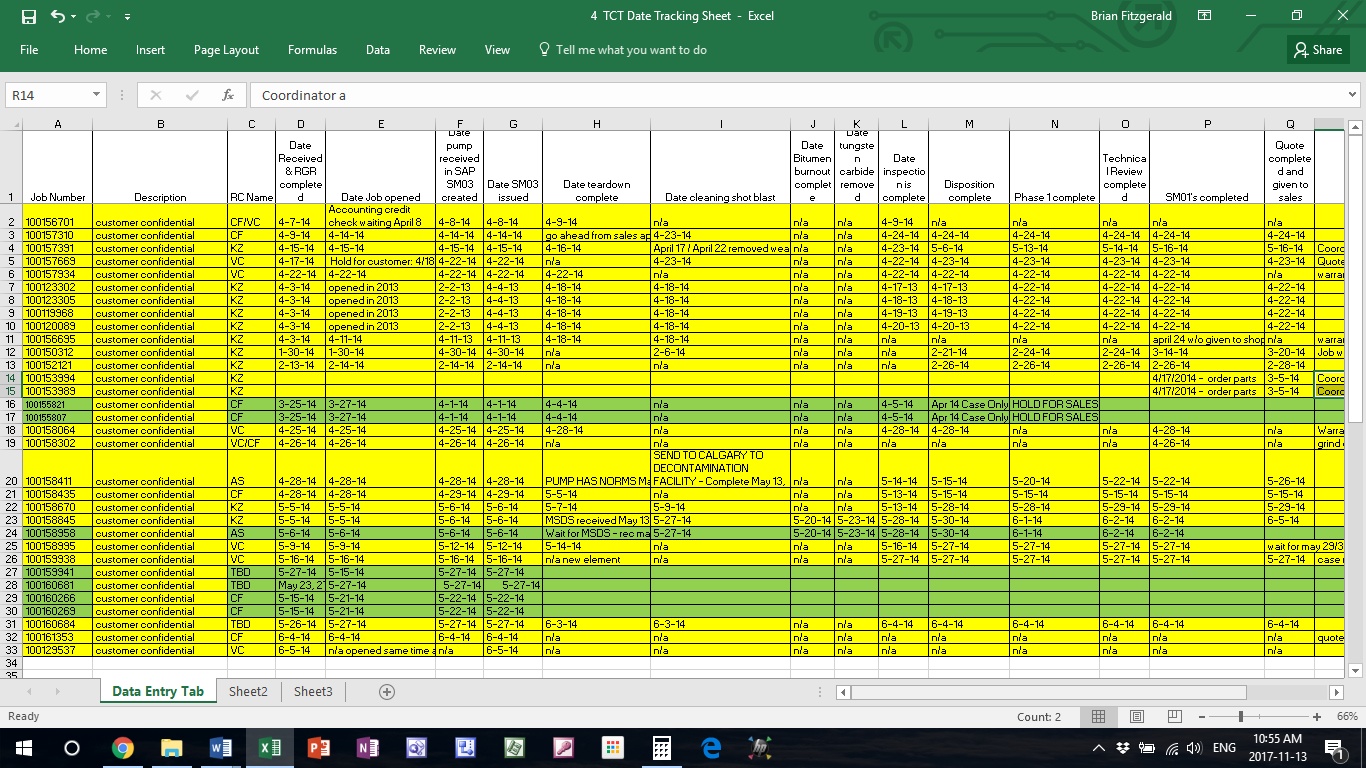
The above data demonstrated that 80% of the delay related to quote preparation was occurring in the shop where jobs were being queued in inspection. The shop leader was prioritizing existing repair jobs over inspection work with the result that many items would wait two weeks in the shop for inspection. The data indicated that if this problem were addressed that the quote lead time would drop to a very acceptable 15 calendar days.
3. Example: Rotating Equipment Repair Centre Quoting and Work in Process card whiteboards
It is impossible to tell from an ERP report the problems which beset a shop or work place. As an adjunct to an ERP report, a visual presentation of a shop's work in the form of cards organized on a whiteboard can quickly give everyone an immediate grasp of the issues. The picture below demonstrates the use of a whiteboard to organize quoting work in a repair facility.

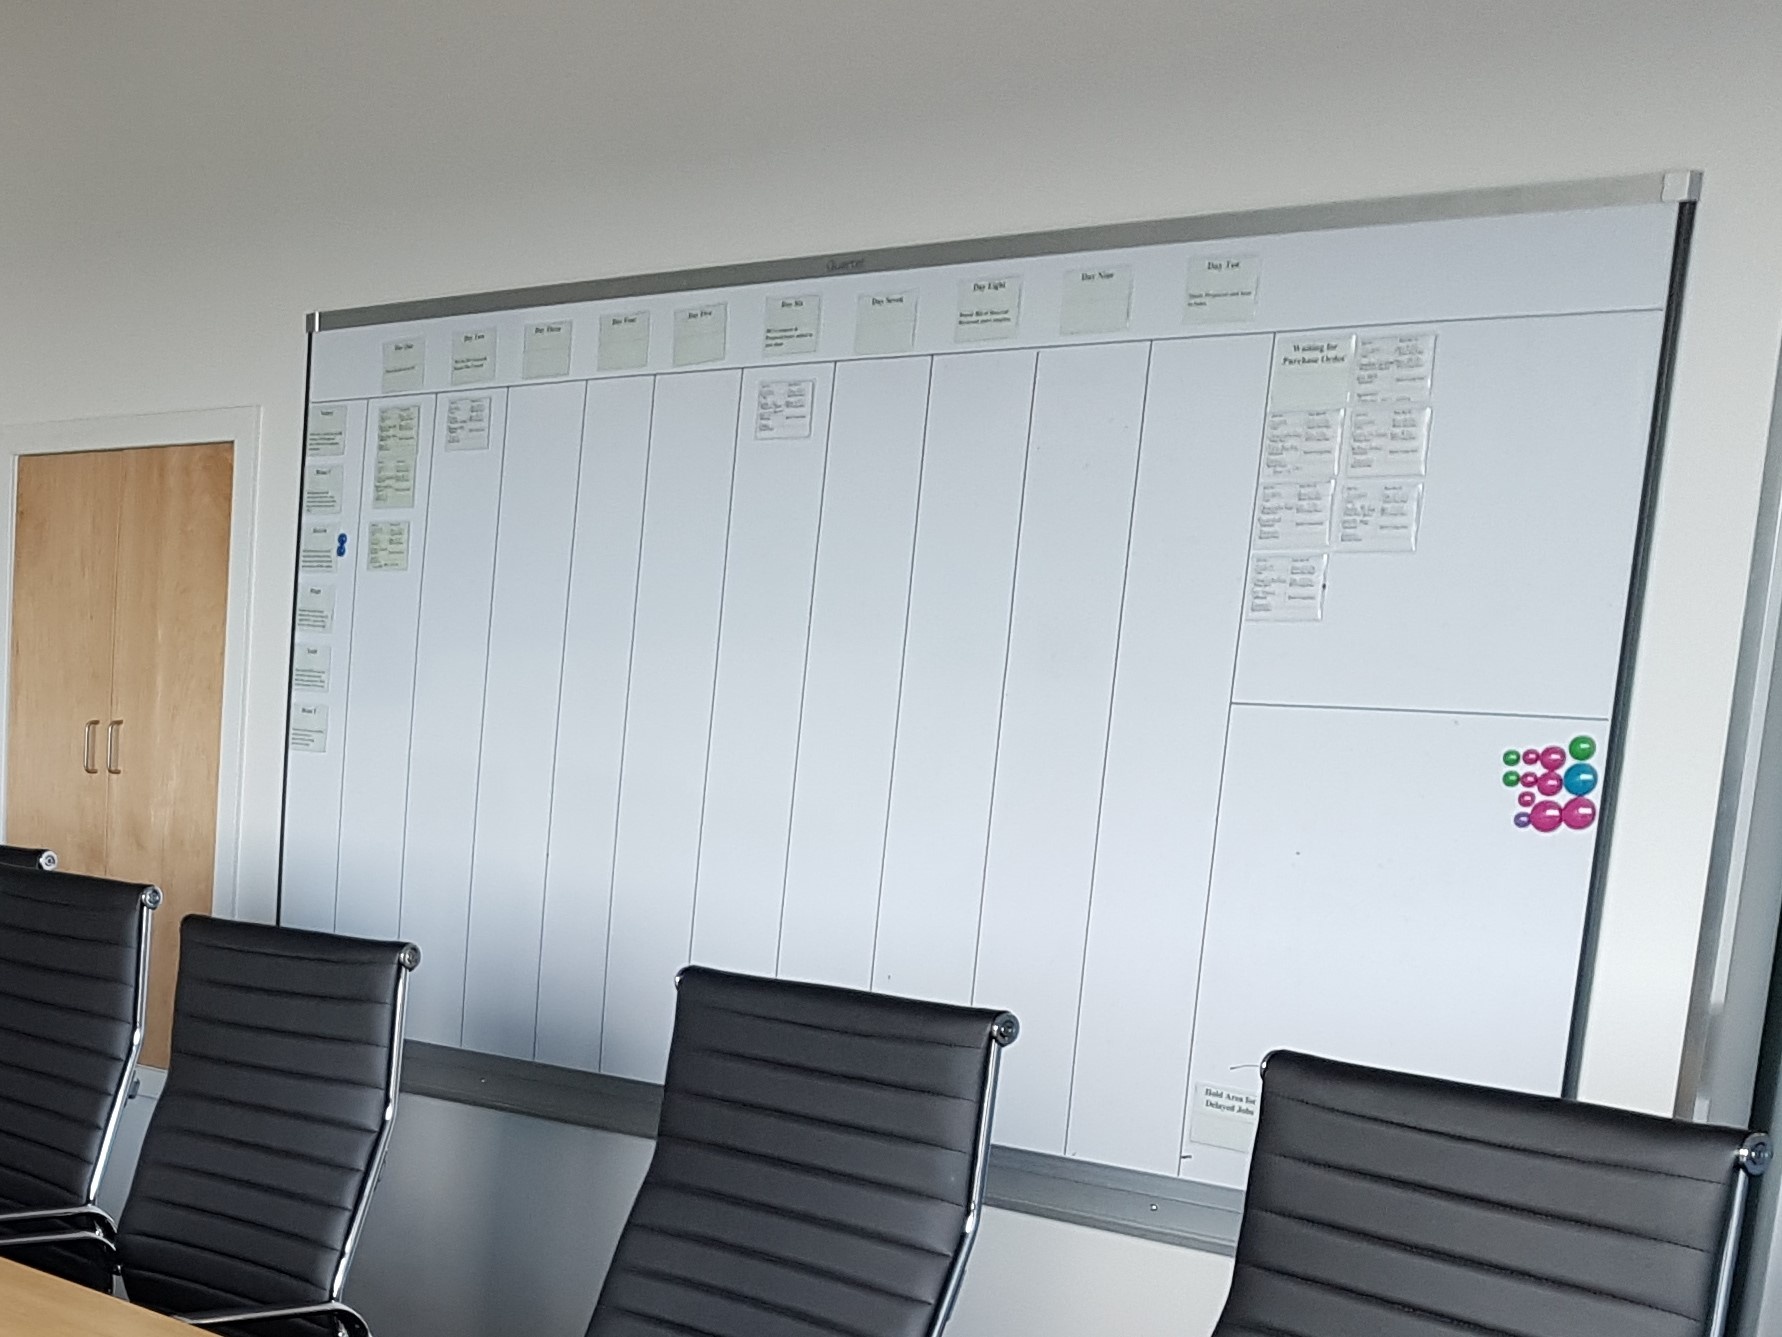
Across the top are column headings labelled days one to ten. From this board it is evident that six jobs already quoted waiting for purchase orders from customers. Further there is only one job in the quoting queue at day six, suggesting that there is a shortage of future work for the shop and that the sales department needs to get busy. A similar board on an adjacent wall was used for work in process. The coloured magnets are used to signal a problem with a job e.g. red for rush or customer or engineering delay, blue for internally manufactured component, purple for third party manufactured component etc. Such a system cuts the finger pointing to a minimum because it is evident to all where the problems exist. Daily meetings focus on action items for staff members on which to focus.
A similar system used in an engineered to order pump plant making 75 to 80 pumps per month was very Pavlovian in that participating parties worked hard to keep their respective colours on the board to a minimum. A total of three whiteboards were used to graphically show 60 days of backlog. Daily meetings with about 20 purchasing, project management and shop planning and supervisory staff were conducted. Over a period of 18 months, on time delivery for pumps went from 35% to a 40 year historical high of 96%. Cost of quality dropped from over 6.5% to under 1% through the same time period.
Closing Comments: The examples provided here illustrate visual solutions to help manage or improve indirect business processes, appropriate to small volume jobbing shops having very little flow. In a high volume manufacturing plant, such visual tools may be inappropriate or as a minimum must be adapted substantially to suit the specialized needs of such an organization having flow. For example in an automotive tier 1 parts plant where the schedules are very level and known months in advance there is no need to visually represent production on a whiteboard, because it is the same every day. In such an operation it is more important to visually represent the APQP process by product and time. Launching new parts is a critical part of the automotive industry. Adherence to timelines is paramount. Such visual project representations are located in "War Rooms".
