Kanban Comments
The abve graphic contrasts the differences between push and pull systems. In a push system there is little or no feedback from the downstream customer with the result that suppliers will try to over produce and inventory of all types, piles up at the supplier.
In contrast most modern kanban systems are electronic with a series of digital communications in the form of electronic data transfer from customer to vendors in the supply chain. The result if coordinated properly creates just in time arrival of inventory at down stream processes. In highly linked and dependent supply chains, inventories are counted once per month to ensure accuracy in the system.
The push system shown is highly simplistic. In the classroom a push system scenario uses a central storeroom from which parts are withdrawn and delivered to each process and then returned to the storeroom after a process step completed. In a five minute test run of such a plant the following observations are obvious:
Almost nothing is produced on time.
There are lots of defects.
There is lots of lost inventory.
Frustration with all players including material handlers is very high.
In the pull system, the material handler feeds the first process with a signal from the next downstream process. Material then flows directly to the next process and so on until it is delivered to the final process packing and shipping. In this five minute test run the following contrasting observations are patently obvious:
The new arrangement produces product on time based on production signals from the next downstream process.
There is no waste nor are there defects.
Previous frustration with product flow is gone.
With this classroom tutorial the following lessons are learned:
Central storerooms as repositories of work in process inventory, raw material and finished goods are dysfunctional and un-productive.
The benefits of flow and connectivity in a series of processes are highly evident.
The end benefit of "one piece flow" becomes evident.
Service Business Caveat: In a service business involved in rotating equipment or mechanical equipment repairs, the application of traditional lean improvements can result in a lot of wasted effort and subsequent frustration with its benefits. A service repair business, receives equipment, dismantles and inspects, prepares a quote and waits for a purchase order. During the purchase order waiting period, the equipment is stored usually on pallets in a racking system. Once an order is received, orders are issued to vendors and the shop to manufacture and or rework components. When all materials needed are ready, assembly and testing proceeds. The product is then shipped.
In such a business, a large storage capacity is needed to support the 0.5 to 6 month or longer delay, waiting for a purchase order. Other than material handling to place stuff in storage and then remove it later for repair and assembly, there is very little material handling during the repair, assembly test and packaging process. During the repair, and overhaul process there is also very little linkage between subsequent processes. Therefore any effort to reduce material handling by moving equipment around to create flow, will expend valuable resources with virtually no reward.
Such businesses have a very high level of product variation and a batch size of typically one unit. Continuous improvement efforts in such firms should be focused on error proofing to minimize things gone wrong and the compression of both the quoting lead time and the repair lead time.
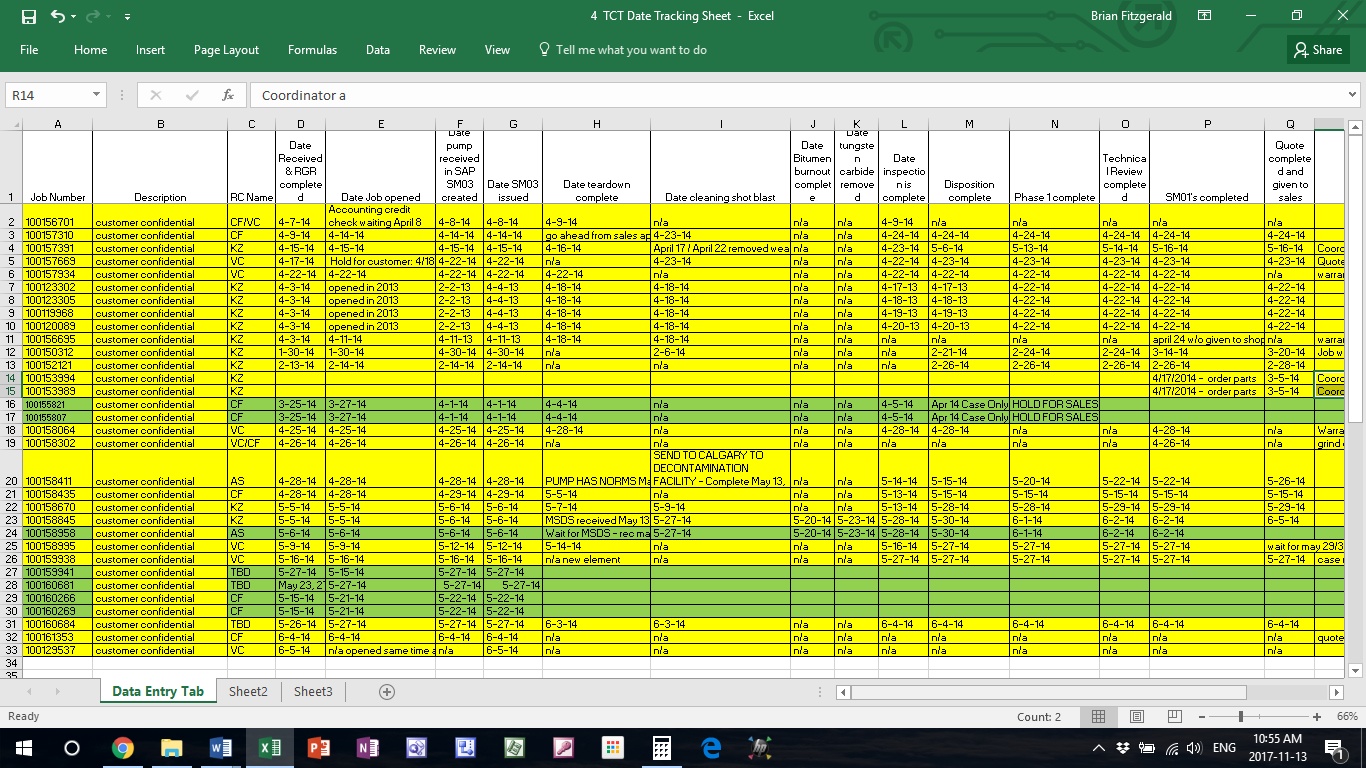
As an example of how to approach such a problem it is ever prudent to collect some data. A Canadian pump repair centre had seen their quote preparation metric deteriorate from an acceptable 20 days back up to 30 days. In a meeting involving several stake holders several theories were proposed as root causes of the problem. After the meeting the general manager was concerned that a number of the proposed root causes might be specious and it would be prudent to collect some raw data. Accordingly repair coordinators were asked for two months to populate a spreadsheet with repair process step dates. The raw data (sanitized to maintain confidentiality) is presented below.

Analysis: A few hours were needed to cleanup this data by adding assumptions in cells regarding the completion of steps for each job. All text comments were replaced with dates. Extra columns were added to calculate the days between each step (pair of columns). Averages were tallied at the foot of each column.
Following the Pareto dictum that one problem generally accounts for 80% of the delay it became evident that the time waiting for inspection in the shop was accountable for 60% of the quote preparation cycle. The shop was prioritizing the completion of existing repairs and queuing jobs in a line until shop labour was available to dismantle clean and inspect. Jobs were sitting weeks after receipt before any work was initiated. If the queue inspection waiting time was reduced to zero the data suggested that quotes could be completed in 15 days, significantly quicker than the historical 20 day target.
This root cause was not in the original set of root causes proffered in the original continuous improvement meeting, and was a revelation to everyone including the general manager. With this information the site changed its priorities to assign equal priority to quoting work and work in process. Other action items were added to handle the uneven flow of work in dismantle clean and inspect and work in process to avoid inappropriate delays.
The lesson here is that any effort to adopt the stakeholders original root cause corrective actions, would have 1. yielded no benefit and 2. wasted at least six months of valuable time. The lesson here is that focus on a kanban approach to improving flow would have been of no benefit.
 Home
Home